INFORMATION DESIGN
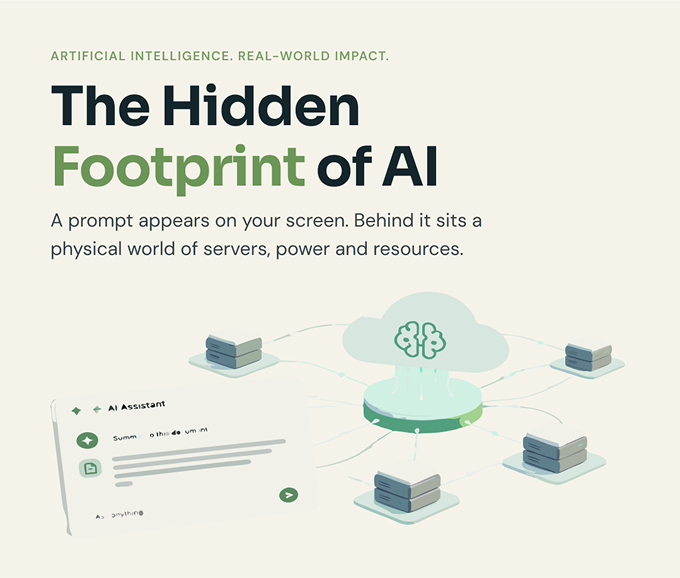
The Hidden Footprint of AI
An editorial infographic connecting AI’s digital experience to its physical environmental footprint.

Electricity. Water. Carbon. Hardware. A connected visual story about the infrastructure behind the interface.
THE BRIEF
AI is experienced through a screen, but its supporting infrastructure is physical. This infographic creates a reading path through electricity, water, carbon and hardware, then widens the lens to scale, potential and recommendations.
01 / ORIENT
02 / EXPLAIN
03 / CONNECT
THE DESIGN APPROACH
A deliberate reading order gives each topic enough space while keeping the wider story connected.
RESPONSIVE EXPERIENCE
Let the evidence lead the eye.
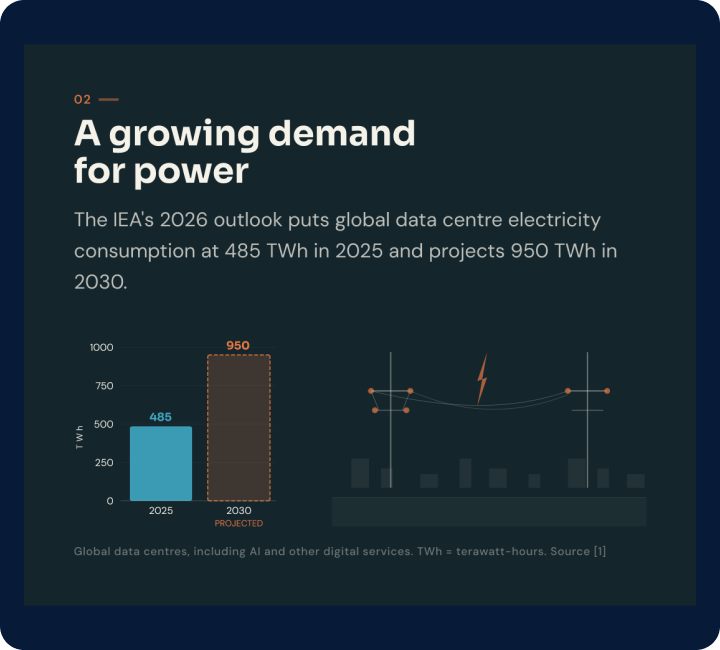
The electricity section pairs a large comparison with smaller context, explicit units and a source note. It is one example of how the infographic gives the claim, its scale and its qualifications separate visual roles.
CORE SCREENS

THE DELIVERABLE
A clear record of the design output and the decisions carried through it.